Code
library(tidyverse)
library(tidymodels)
library(broom)library(tidyverse)
library(tidymodels)
library(broom)house <- read_csv('https://raw.githubusercontent.com/rfordatascience/tidytuesday/master/data/2023/2023-11-07/house.csv')
glimpse(house)Rows: 32,452
Columns: 20
$ year <dbl> 1976, 1976, 1976, 1976, 1976, 1976, 1976, 1976, 1976, 1…
$ state <chr> "ALABAMA", "ALABAMA", "ALABAMA", "ALABAMA", "ALABAMA", …
$ state_po <chr> "AL", "AL", "AL", "AL", "AL", "AL", "AL", "AL", "AL", "…
$ state_fips <dbl> 1, 1, 1, 1, 1, 1, 1, 1, 1, 1, 1, 1, 1, 1, 1, 1, 1, 1, 1…
$ state_cen <dbl> 63, 63, 63, 63, 63, 63, 63, 63, 63, 63, 63, 63, 63, 63,…
$ state_ic <dbl> 41, 41, 41, 41, 41, 41, 41, 41, 41, 41, 41, 41, 41, 41,…
$ office <chr> "US HOUSE", "US HOUSE", "US HOUSE", "US HOUSE", "US HOU…
$ district <chr> "001", "001", "001", "002", "002", "002", "003", "003",…
$ stage <chr> "GEN", "GEN", "GEN", "GEN", "GEN", "GEN", "GEN", "GEN",…
$ runoff <lgl> FALSE, FALSE, FALSE, FALSE, FALSE, FALSE, FALSE, FALSE,…
$ special <lgl> FALSE, FALSE, FALSE, FALSE, FALSE, FALSE, FALSE, FALSE,…
$ candidate <chr> "BILL DAVENPORT", "JACK EDWARDS", "WRITEIN", "J CAROLE …
$ party <chr> "DEMOCRAT", "REPUBLICAN", NA, "DEMOCRAT", "REPUBLICAN",…
$ writein <lgl> FALSE, FALSE, TRUE, FALSE, FALSE, TRUE, FALSE, FALSE, T…
$ mode <chr> "TOTAL", "TOTAL", "TOTAL", "TOTAL", "TOTAL", "TOTAL", "…
$ candidatevotes <dbl> 58906, 98257, 7, 66288, 90069, 5, 106935, 1111, 2, 3453…
$ totalvotes <dbl> 157170, 157170, 157170, 156362, 156362, 156362, 108048,…
$ unofficial <lgl> FALSE, FALSE, FALSE, FALSE, FALSE, FALSE, FALSE, FALSE,…
$ version <dbl> 20230706, 20230706, 20230706, 20230706, 20230706, 20230…
$ fusion_ticket <lgl> FALSE, FALSE, FALSE, FALSE, FALSE, FALSE, FALSE, FALSE,…house %>%
count(party, sort = TRUE)# A tibble: 478 × 2
party n
<chr> <int>
1 DEMOCRAT 9908
2 REPUBLICAN 9705
3 <NA> 3858
4 LIBERTARIAN 2769
5 INDEPENDENT 1217
6 CONSERVATIVE 668
7 GREEN 513
8 NATURAL LAW 371
9 WORKING FAMILIES 283
10 LIBERAL 266
# ℹ 468 more rowshouse %>%
filter(party %in% c("DEMOCRAT", "REPUBLICAN")) |>
ggplot(aes(candidatevotes / totalvotes, fill = party)) +
geom_histogram(position = "identity", bins = 40, alpha = 0.7) +
scale_x_continuous(labels = scales::percent_format()) +
labs(x = "% of total votes", y = "Number of elections", fill = NULL)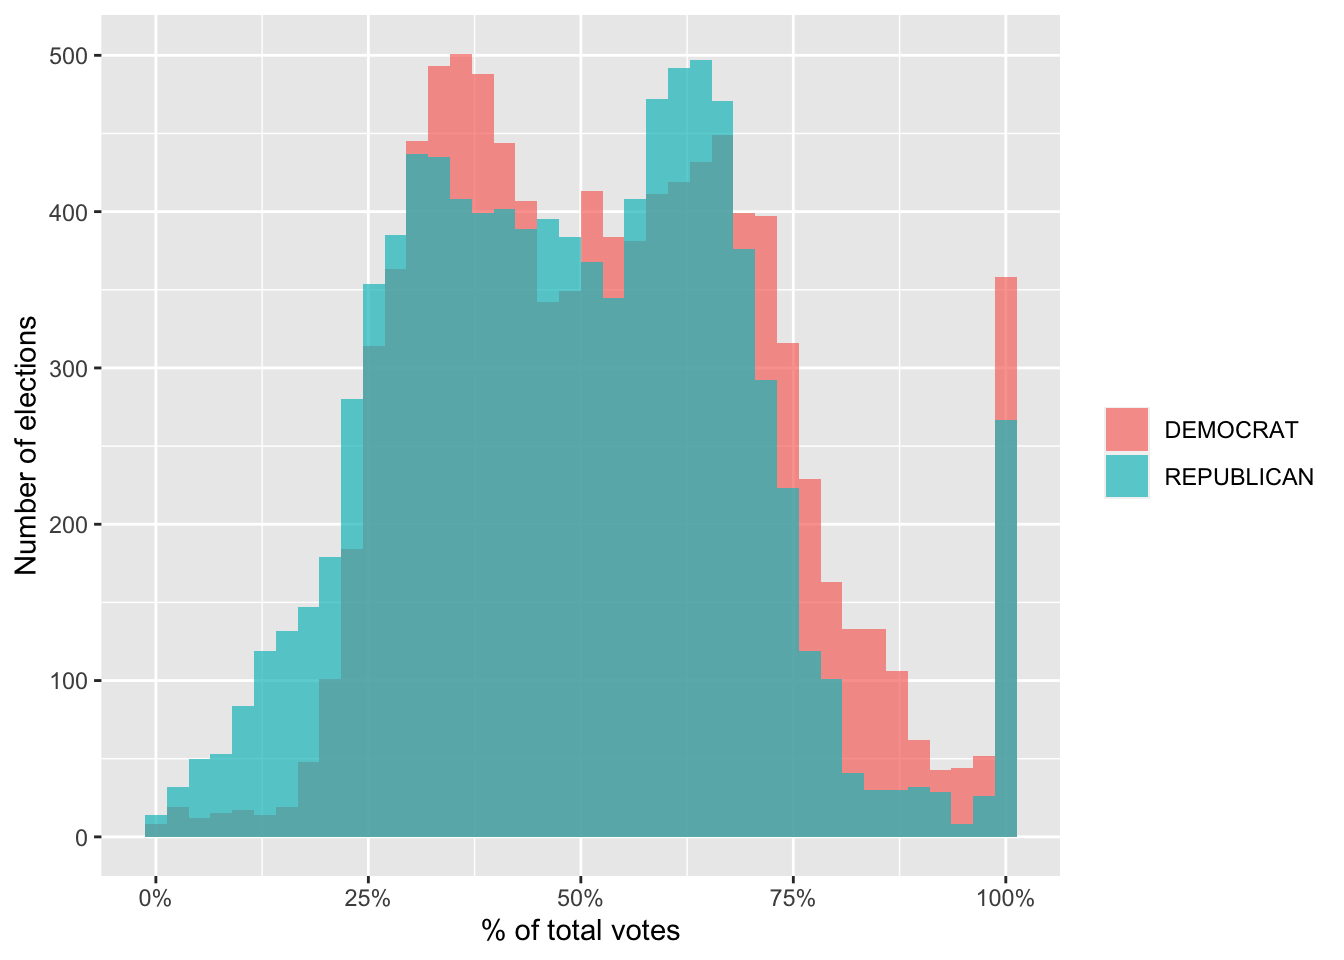
house |>
    filter(party %in% c("DEMOCRAT", "REPUBLICAN"))  %>%
    ggplot(aes(year, candidatevotes / totalvotes, fill = factor(year))) +
    geom_boxplot(alpha = 0.8, show.legend = FALSE) +
    scale_y_continuous(labels = scales::percent_format()) +
    scale_fill_viridis_d() +
    labs(x = NULL, y = "% of total votes", fill = NULL)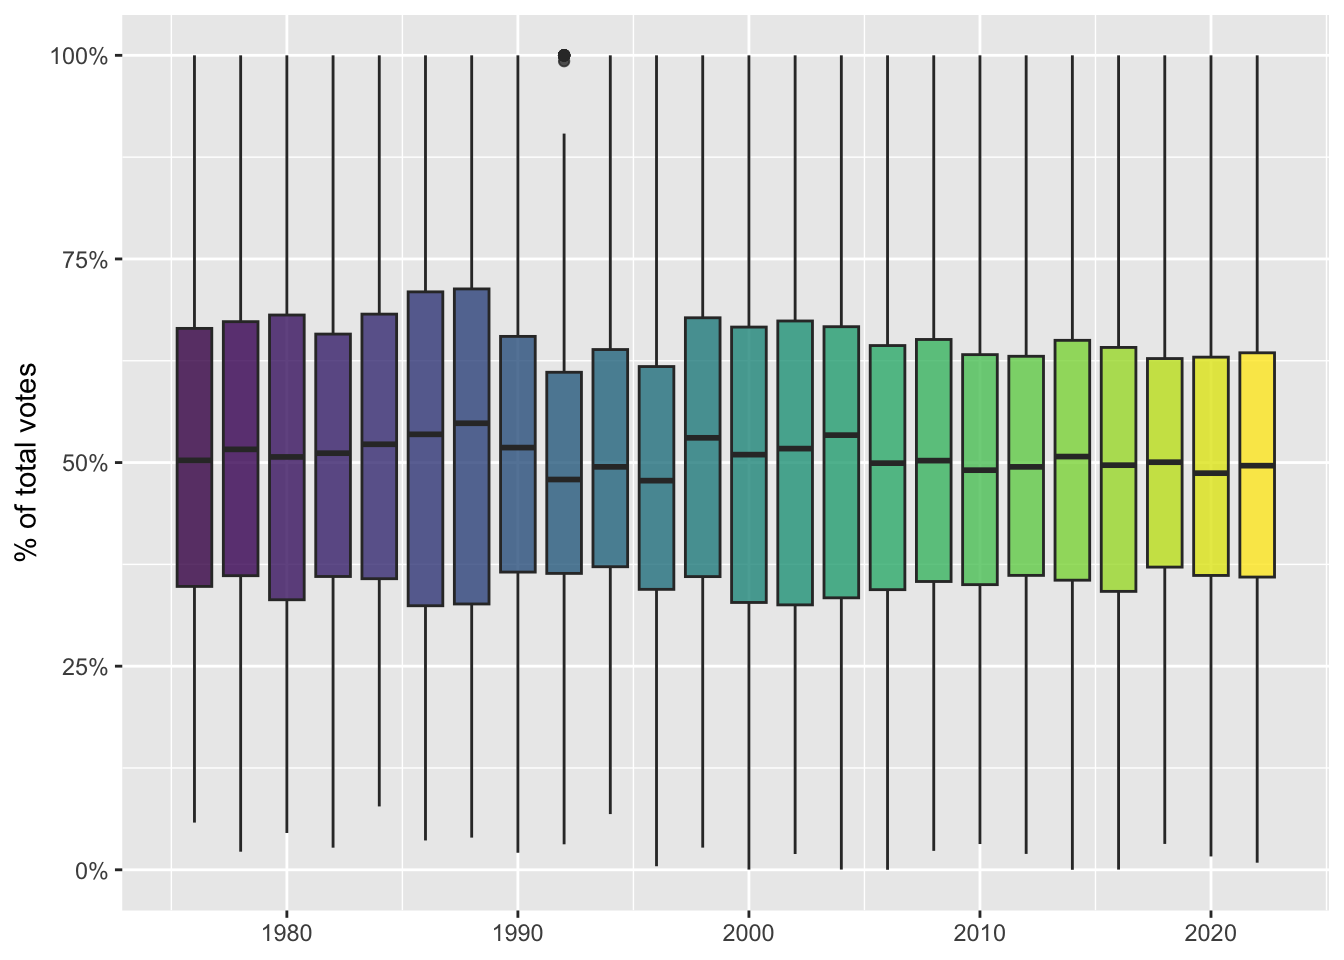
house_subset =
    house %>%
filter(party %in% c("DEMOCRAT", "REPUBLICAN"))house_mod <-
glm(cbind(candidatevotes, totalvotes - candidatevotes + 1) ~
party + year + state_po,
data = house_subset, family = binomial())summary(house_mod)
Call:
glm(formula = cbind(candidatevotes, totalvotes - candidatevotes +
    1) ~ party + year + state_po, family = binomial(), data = house_subset)

Coefficients:
                  Estimate Std. Error  z value Pr(>|z|)
(Intercept)      2.988e+00  4.569e-03   653.82   <2e-16 ***
partyREPUBLICAN -7.959e-02  6.236e-05 -1276.26   <2e-16 ***
year            -1.542e-03  2.263e-06  -681.37   <2e-16 ***
state_poAL       4.209e-01  6.497e-04   647.90   <2e-16 ***
state_poAR       2.365e-01  6.893e-04   343.14   <2e-16 ***
state_poAZ       1.503e-01  6.381e-04   235.49   <2e-16 ***
state_poCA       1.275e-01  5.978e-04   213.23   <2e-16 ***
state_poCO       1.019e-01  6.322e-04   161.12   <2e-16 ***
state_poCT       6.004e-02  6.439e-04    93.24   <2e-16 ***
state_poDC      -7.689e-01  2.248e-03  -341.99   <2e-16 ***
state_poDE       1.047e-01  8.086e-04   129.44   <2e-16 ***
state_poFL       2.079e-01  6.064e-04   342.91   <2e-16 ***
state_poGA       3.148e-01  6.232e-04   505.12   <2e-16 ***
state_poHI       1.014e-01  7.648e-04   132.64   <2e-16 ***
state_poIA       1.295e-01  6.476e-04   199.96   <2e-16 ***
state_poID       9.791e-02  7.241e-04   135.21   <2e-16 ***
state_poIL       1.669e-01  6.076e-04   274.74   <2e-16 ***
state_poIN       1.087e-01  6.247e-04   174.07   <2e-16 ***
state_poKS       1.634e-01  6.632e-04   246.44   <2e-16 ***
state_poKY       2.042e-01  6.468e-04   315.68   <2e-16 ***
state_poLA      -6.333e-01  6.500e-04  -974.33   <2e-16 ***
state_poMA       3.427e-01  6.252e-04   548.15   <2e-16 ***
state_poMD       1.046e-01  6.290e-04   166.35   <2e-16 ***
state_poME       5.382e-02  6.869e-04    78.36   <2e-16 ***
state_poMI       1.209e-01  6.097e-04   198.25   <2e-16 ***
state_poMN       7.655e-02  6.363e-04   120.31   <2e-16 ***
state_poMO       1.054e-01  6.238e-04   168.99   <2e-16 ***
state_poMS       2.073e-01  6.769e-04   306.30   <2e-16 ***
state_poMT       7.755e-02  7.482e-04   103.66   <2e-16 ***
state_poNC       1.688e-01  6.169e-04   273.55   <2e-16 ***
state_poND       1.639e-01  8.302e-04   197.37   <2e-16 ***
state_poNE       1.696e-01  6.950e-04   244.00   <2e-16 ***
state_poNH       9.174e-02  7.260e-04   126.37   <2e-16 ***
state_poNJ       1.133e-01  6.168e-04   183.65   <2e-16 ***
state_poNM       1.415e-01  7.076e-04   199.96   <2e-16 ***
state_poNV       6.186e-02  7.040e-04    87.86   <2e-16 ***
state_poNY      -1.406e-01  6.031e-04  -233.18   <2e-16 ***
state_poOH       1.440e-01  6.077e-04   236.96   <2e-16 ***
state_poOK       1.355e-01  6.573e-04   206.09   <2e-16 ***
state_poOR       1.225e-01  6.406e-04   191.17   <2e-16 ***
state_poPA       2.200e-01  6.072e-04   362.31   <2e-16 ***
state_poRI       1.004e-01  7.608e-04   131.96   <2e-16 ***
state_poSC       2.450e-01  6.503e-04   376.81   <2e-16 ***
state_poSD       1.695e-01  7.887e-04   214.93   <2e-16 ***
state_poTN       2.259e-01  6.353e-04   355.53   <2e-16 ***
state_poTX       2.379e-01  6.044e-04   393.52   <2e-16 ***
state_poUT       7.721e-02  6.833e-04   113.00   <2e-16 ***
state_poVA       2.731e-01  6.240e-04   437.61   <2e-16 ***
state_poVT      -2.115e-01  8.717e-04  -242.62   <2e-16 ***
state_poWA       1.358e-01  6.225e-04   218.22   <2e-16 ***
state_poWI       2.036e-01  6.238e-04   326.40   <2e-16 ***
state_poWV       2.498e-01  7.163e-04   348.75   <2e-16 ***
state_poWY       3.970e-02  8.805e-04    45.09   <2e-16 ***
---
Signif. codes:  0 '***' 0.001 '**' 0.01 '*' 0.05 '.' 0.1 ' ' 1

(Dispersion parameter for binomial family taken to be 1)

    Null deviance: 644839486  on 19611  degrees of freedom
Residual deviance: 622385502  on 19559  degrees of freedom
AIC: 622624777

Number of Fisher Scoring iterations: 4tidy(house_mod)# A tibble: 53 × 5
term estimate std.error statistic p.value
<chr> <dbl> <dbl> <dbl> <dbl>
1 (Intercept) 2.99 0.00457 654. 0
2 partyREPUBLICAN -0.0796 0.0000624 -1276. 0
3 year -0.00154 0.00000226 -681. 0
4 state_poAL 0.421 0.000650 648. 0
5 state_poAR 0.237 0.000689 343. 0
6 state_poAZ 0.150 0.000638 235. 0
7 state_poCA 0.127 0.000598 213. 0
8 state_poCO 0.102 0.000632 161. 0
9 state_poCT 0.0600 0.000644 93.2 0
10 state_poDC -0.769 0.00225 -342. 0
# ℹ 43 more rowsnew_data <-
crossing(party = c("DEMOCRAT", "REPUBLICAN"),
state_po = unique(house_subset$state_po),
year = 1975:2022)
augment(house_mod, newdata = new_data, type.predict = "response") |>
mutate(group = paste(party, state_po, sep = "_")) |>
ggplot(aes(year, .fitted, group = group, color = party)) +
geom_hline(yintercept = 0.5, linetype = "dashed", alpha = 0.5, size = 2, color = "gray50") +
geom_line(alpha = 0.4, size = 1.4, show.legend = FALSE) +
scale_y_continuous(labels = scales::percent_format()) +
facet_wrap(vars(party)) +
labs(x = NULL, y = "% of total votes", color = NULL)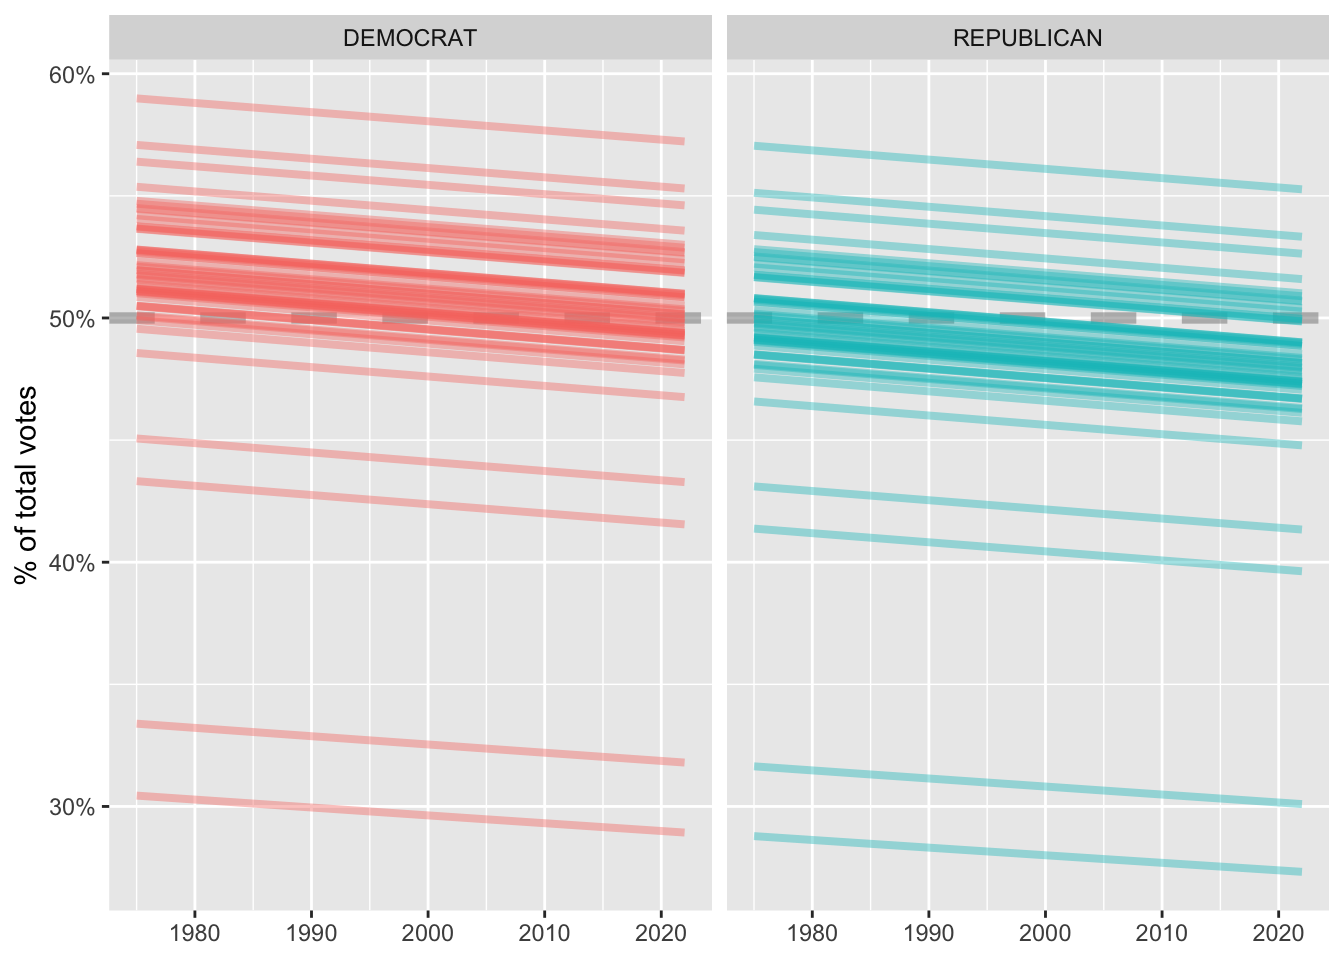
house_interact <-
    glm(cbind(candidatevotes, totalvotes - candidatevotes + 1) ~
            party * year + state_po,
        data = house_subset, family = binomial())

augment(house_interact, newdata = new_data, type.predict = "response") |>
    mutate(group = paste(party, state_po, sep = "_")) |>
    ggplot(aes(year, .fitted, group = group, color = party)) +
    geom_hline(yintercept = 0.5, linetype = "dashed", alpha = 0.5, size = 2, color = "gray50") +
    geom_line(alpha = 0.4, size = 1.4, show.legend = FALSE) +
    scale_y_continuous(labels = scales::percent_format()) +
    facet_wrap(vars(party)) +
    labs(x = NULL, y = "% of total votes", color = NULL)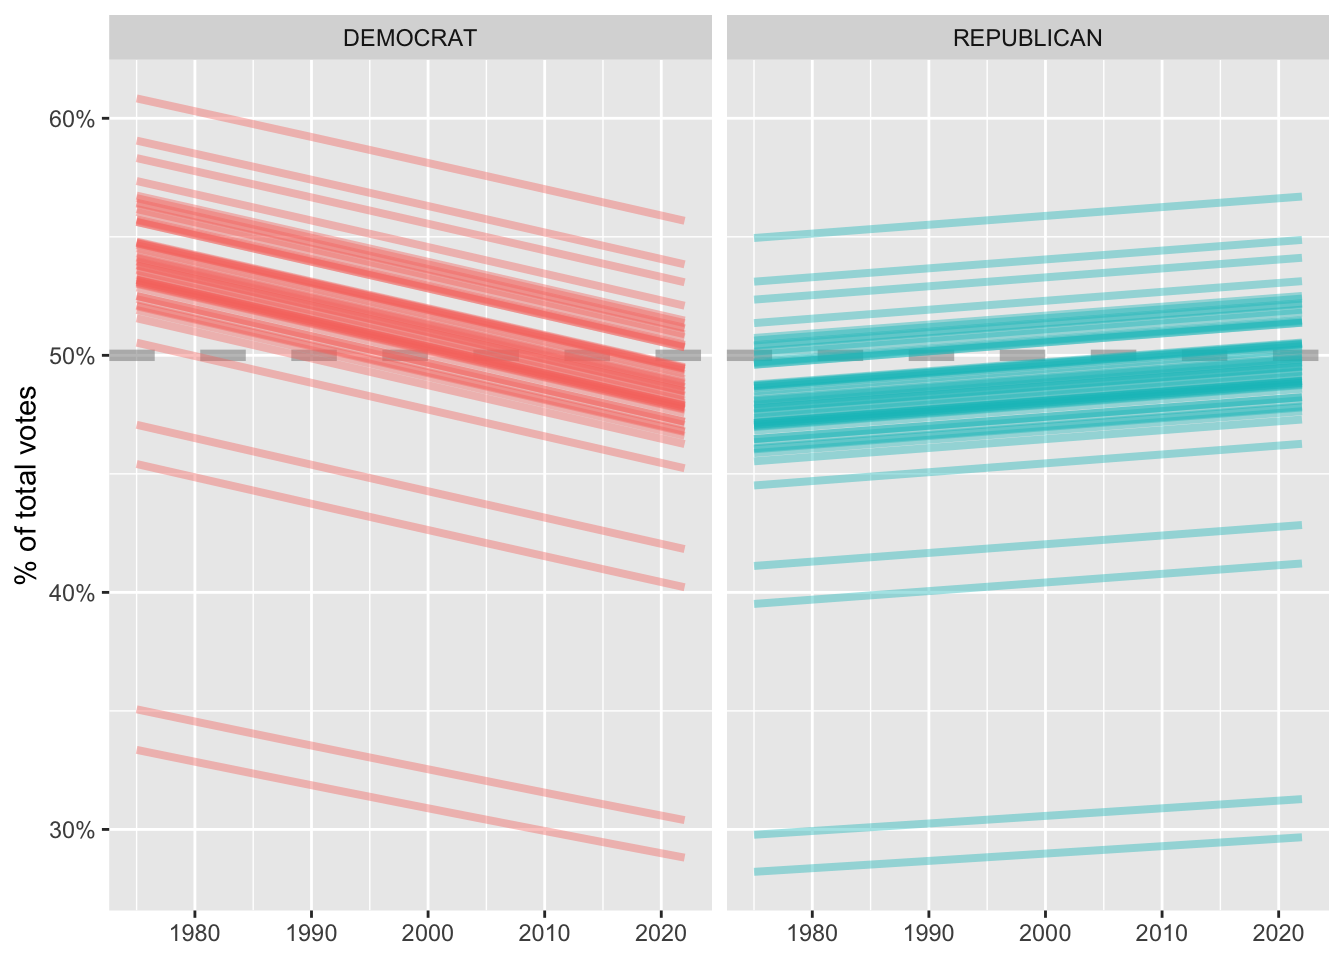
[Youtuber]Logistic regression for US House election vote share: https://www.youtube.com/watch?v=C143WxnBLFo
Code: https://juliasilge.com/blog/house-elections/
copilot: https://docs.posit.co/ide/user/ide/guide/tools/copilot.html